Hubble observations have revealed a giant 10-sided atmospheric wave around Saturn’s south pole — the first large regular-sided jet pattern ever seen in the planet’s southern hemisphere. The feature was not visible in Cassini-era observations, appears faintly in Hubble data from 2023 and becomes much clearer in 2025. Unlike Saturn’s famous north-polar hexagon, the new decagon is still evolving, drifts eastward relative to the planet and appears to extend through multiple atmospheric layers. That gives scientists something unusually valuable: a chance to watch a giant planetary wave form rather than only study one after it has stabilized.
Saturn Already Had a Hexagon — Now It Has a Decagon
Saturn has spent decades being the planet with the impossible-looking hexagon.
Voyager first revealed the six-sided atmospheric pattern around the north pole in the early 1980s.
Cassini later showed that the hexagon was not a photographic illusion.
It was a real, enormous wave embedded in a powerful jet stream.
Now Saturn has produced something even stranger in the opposite hemisphere.
Hubble observations have revealed a 10-sided wave around the south pole.
A decagon.
This is the first large regular-sided jet pattern ever observed in Saturn’s southern hemisphere.
The surprise is not only the geometry.
The pattern appears to be new.
The New Shape Was Not Sitting There Waiting to Be Noticed
Researchers have searched for a southern counterpart to Saturn’s northern hexagon for decades.
They did not find one.
Cassini orbited Saturn from 2004 to 2017 and observed the south-polar region in detail.
According to the new Hubble study, those observations showed no evidence of a long-lived decagon.
Then the geometry changed.
Saturn’s seasons gradually brought the south pole back into better view from Earth.
Ground-based observers began noticing an unusual wavy band.
Hubble data then showed that the structure was already faintly present in 2023.
By 2025 it had become much more obvious.
That makes this less like discovering an old landmark.
It looks more like catching one while it develops.
That Is What Makes This Discovery Rare
Planetary scientists often discover atmospheric structures after they are already mature.
A storm exists.
A jet exists.
A vortex exists.
Researchers then try to reconstruct how it formed from theory and limited historical data.
Saturn’s decagon offers a different opportunity.
Hubble has annual observations stretching across multiple years.
Researchers can compare weak early signatures with later, sharper geometry.
If the feature continues evolving, future observations may capture its transition toward stability — or its disappearance.
Either outcome would help constrain the physics that creates giant planetary waves.
The Decagon Sits Inside a Powerful Jet Stream
The 10-sided pattern is not a solid structure.
It is an atmospheric wave.
The wave is embedded within one of Saturn’s strong eastward jet streams around the southern polar region.
The Science Advances paper places the pattern roughly between 58 and 63 degrees south latitude.
Its sides are produced by a meandering jet.
Instead of flowing around the planet as a smooth ring, the current bends into a repeating geometric pattern.
That is the same broad family of explanation used for Saturn’s famous northern hexagon.
But the two systems are not identical.
The New Decagon Is Much Less Stationary Than the Northern Hexagon
Saturn’s northern hexagon has one especially strange property.
Its large-scale pattern remains nearly stationary relative to the planet’s internal rotation.
The new southern decagon behaves differently.
The published study reports that the pattern drifts eastward at about 2.5 meters per second.
The jet carrying it is far faster — around 116 meters per second near 60.5 degrees south.
That means the atmospheric gas races through the region while the large-scale wave moves comparatively slowly.
The wave and the wind are not the same thing.
That distinction is central to understanding planetary atmospheric waves.
A Wave Can Move Slowly While the Atmosphere Rushes Through It
Think about a standing wave in flowing water.
The water itself can move rapidly while a visible pattern persists in roughly one place.
Planetary atmospheres can behave similarly.
The geometric structure does not mean the same cloud particles stay at each corner.
The pattern is an organized disturbance in the flow.
Saturn’s decagon is therefore better understood as a wave mode in a fast-moving jet than as a 10-sided cloud object.
That is why researchers focus on jet speed, wave drift, curvature and atmospheric stability rather than treating each side as a separate storm.
The Vertices Move Too
The new paper reports that the longitudes of the decagon’s vertices oscillate.
The oscillation period is about 32 days.
The measured amplitudes range from roughly 4.6 to 8.4 degrees.
That means the corners are not permanently nailed to fixed longitudes.
The geometry itself breathes and shifts.
This is another clue that the southern structure is dynamically different from the long-lived north-polar hexagon.
It may still be settling into a stable mode.
Or it may never become as stable as the northern feature.
Hubble Can See the Shape at Different Altitudes
One of the strongest pieces of evidence is spectral.
Hubble did not observe the feature in only one visible-light image.
Different filters probe different heights in Saturn’s atmosphere.
NASA says the decagon’s apparent location shifts slightly between wavelengths.
That is expected when different layers of the atmosphere are being sampled.
The important conclusion is that the wave extends vertically through multiple atmospheric layers.
It is not merely a thin pattern painted on one cloud deck.
The structure has depth.
That Makes the Decagon a Three-Dimensional Atmospheric Structure
A cloud-top feature can be visually dramatic without extending far below or above the level where it is visible.
The decagon appears more substantial.
Hubble’s multi-wavelength view indicates that the disturbance occupies a vertical atmospheric column.
That gives researchers another constraint.
Any model that explains the decagon has to reproduce not only the 10-sided horizontal geometry but also its vertical behavior.
This is why future observations with Hubble and Webb matter.
Different wavelengths can probe different pressure levels and help reconstruct the wave in three dimensions.
The First Clues Came From Ground-Based Observers
Hubble confirmed the decagon.
It did not generate the first suspicion.
Researchers analyzing ground-based images noticed an unusual undulating band near Saturn’s south pole.
The observations were collected through the Planetary Virtual Observatory Laboratory, which accepts planetary images from observers around the world.
Lead author Agustín Sánchez-Lavega and amateur astronomers Trevor Barry and Jean-Paul Oger noticed the subtle pattern in 2024 imagery.
Additional ground-based observations in 2025 made the geometry more convincing.
Then the team turned to Hubble’s sharper data.
Amateur Observations Helped Trigger a Space-Telescope Investigation
This is a useful reminder of how planetary science actually works.
A modern observatory does not automatically detect every changing feature.
Saturn is large.
Its atmosphere changes continuously.
Professional telescope time is limited.
Skilled ground-based observers can monitor the planet frequently and notice changes that deserve closer inspection.
In this case, those observations helped direct attention toward a subtle southern wave.
Hubble then provided the spatial resolution needed to establish the 10-sided structure more clearly.
The discovery is a networked observation story, not a single-image surprise.
Hubble’s Archive Rewound the Formation Back to 2023
Once researchers knew what to look for, older Hubble observations became more valuable.
The team found weaker signatures of the structure in data from 2023 and 2024.
Those early images show less pronounced contrast and less obvious sides.
By 2025 the polygon is clearer.
That historical sequence matters.
It converts a single discovery image into evidence of evolution.
The object is not merely present.
Its visual strength has changed with time.
Cassini’s Silence Creates a Formation Window
Cassini gives the story a lower boundary.
The spacecraft repeatedly observed Saturn through 2017.
Researchers report no comparable long-lived southern decagon in those data.
Hubble confirms the feature by 2023.
That means the current structure likely developed sometime after the Cassini era and before or around the earliest Hubble evidence.
Scientists cannot yet say exactly when the wave formed.
But they can constrain the interval far better than they could without Cassini’s historical record.
Saturn’s Seasons May Be Part of the Story
Saturn takes about 29 Earth years to orbit the Sun.
Its seasons therefore unfold slowly.
The visibility, heating and atmospheric behavior of the polar regions change over years.
The new decagon emerged as Saturn’s southern hemisphere became increasingly observable from Earth again.
That does not prove seasonal forcing created the wave.
Timing alone is not causation.
But seasonal changes alter solar heating and atmospheric structure, so researchers will naturally ask whether the changing southern environment helped make the jet unstable enough to form the pattern.
One Hypothesis Starts With a Disturbance in the Jet
The Science Advances study uses shallow-water modeling to explore how a 10-sided wave could appear.
One possibility is that a spatially periodic disturbance developed near the peak of the jet.
If the disturbance has the right scale and the jet has the right curvature, a large meandering wave can become trapped.
The result can organize into a repeating polygonal pattern.
This is not yet a confirmed formation history.
It is a physically plausible route produced by the models.
Another Hypothesis Involves a Dark Anticyclonic Vortex
The study also considers another possible trigger.
A dark anticyclonic vortex lies immediately north of the decagon.
The vortex may have disturbed the nearby jet strongly enough to excite the wave.
Large vortices can exchange momentum with surrounding flows.
They can push jets.
They can generate waves.
They can reorganize local atmospheric circulation.
If that mechanism is correct, the decagon may be less like a spontaneously appearing polygon and more like a jet responding to a nearby atmospheric disturbance.
The Models Do Not Yet Pick One Winner
Researchers are not claiming that one simulation has solved the mystery.
The current observations support multiple plausible pathways.
A periodic disturbance in the jet could generate the wave.
A nearby vortex could force it.
Other factors may also contribute.
The important scientific step is that the observations now give modelers something specific to reproduce.
Ten sides.
A measured latitude range.
A measured drift rate.
Vertex oscillations.
Vertical structure.
Time evolution.
Those constraints turn the decagon from a visual curiosity into a fluid-dynamics problem.
Why Polygons Can Form in a Gas Giant at All
Polygonal atmospheric patterns look artificial because our intuition expects winds to form circles and spirals.
But rotating fluids support many stable and semi-stable wave modes.
When a fast jet interacts with planetary rotation, pressure gradients and surrounding flows, the jet can meander.
Under the right conditions, those meanders organize into a repeating pattern.
The corners are not rigid.
They are points in a wave.
Saturn’s rapid rotation and powerful zonal jets create an environment where this kind of organized geometry can persist at enormous scale.
Saturn Is Unusually Good at Making Atmospheric Geometry
Other planets have jets.
Other planets have giant vortices.
Jupiter has spectacular polar cyclone arrangements.
But Saturn is the planet where large atmospheric waves repeatedly take on simple polygonal geometry.
The northern hexagon is the famous example.
The southern decagon now extends that mystery.
The question becomes broader:
What is special about Saturn’s jet structure that allows such clean polygonal modes?
Answering that may teach researchers something about how fast-rotating atmospheres select stable wave patterns.
The Northern Hexagon Is the Perfect Comparison — and a Dangerous One
The hexagon makes the decagon immediately understandable.
It can also encourage bad assumptions.
The southern structure has 10 sides instead of six.
It drifts differently.
Its vertices oscillate.
It appears to be newly formed.
The northern hexagon has remained visible for more than four decades.
The southern decagon may strengthen, stabilize, weaken or disappear.
So the correct framing is not “Saturn now has the same thing at both poles.”
It has two polygonal atmospheric systems with important differences.
The Size Is Enormous
The decagon spans a planetary scale.
Published reporting based on the study places its diameter at roughly 167,820 kilometers.
That is more than four times Earth’s circumference.
Each side extends for more than 16,000 kilometers.
Those dimensions make the word “wave” feel misleadingly small.
This is an organized atmospheric pattern spanning a substantial fraction of a giant planet.
Its geometry is visible only because the structure is so large.
The Shape Is Not a Perfect Euclidean Decagon
Planetary scientists use the word decagon because the wave presents 10 major sides and vertices.
That does not mean Saturn has drawn a mathematically perfect regular polygon in its clouds.
The vertices shift.
The contrast varies.
The apparent location changes with altitude.
The wave evolves.
The atmosphere is continuous fluid, not a geometric diagram.
The important observation is the persistent 10-fold organization of the jet.
Calling it a decagon is a useful description of the mode, not a claim of perfect geometry.
Why Hubble’s OPAL Program Was Essential
The discovery depends on repetition.
Hubble’s Outer Planet Atmospheres Legacy program has photographed the outer planets regularly for more than a decade.
That creates something planetary scientists rarely had before: consistent long-term atmospheric surveillance.
A one-time observation can reveal a storm.
A decade of observations can reveal climate-scale evolution.
The decagon is a perfect OPAL discovery because its significance comes from change over time.
The 2023 data matter because the 2025 data exist.
The Cassini comparison matters because decades of earlier observations exist.
Long-Term Monitoring Can Discover Things a More Powerful Snapshot Cannot
Astronomy often celebrates deeper images and larger telescopes.
Time coverage is another kind of power.
A telescope that revisits the same world year after year can discover evolution that a single ultradeep observation cannot.
This is particularly important for nearby planets.
Their atmospheres are dynamic systems.
Features emerge.
Merge.
Migrate.
Fade.
Saturn’s decagon is a case where continuity created the science.
The discovery is not only about what Hubble can see.
It is about how long Hubble has been looking.
James Webb Can Add Another Layer of Information
The research team says future observations should include the James Webb Space Telescope.
Webb’s infrared sensitivity can probe atmospheric structure differently from Hubble.
Combined observations could help determine how the wave changes with altitude and temperature.
That matters for testing formation models.
A shallow disturbance and a deeply rooted wave may look similar in one image but behave differently across pressure levels.
The more vertical information researchers obtain, the more tightly they can constrain the physics.
The Next Few Years Could Be More Valuable Than the Discovery Image
The decagon’s future behavior may answer the most interesting question.
Does it settle down?
If the pattern becomes more stable and long-lived, researchers can compare its mature state with the northern hexagon.
If it weakens or disappears, scientists can study the conditions that destroyed it.
If the number of sides changes, that would be even more revealing.
Because the feature appears young, every additional year adds a new point to its dynamical history.
The Discovery Gives Giant-Planet Models a New Test
Atmospheric models are useful when they predict or reproduce real structures.
Saturn’s decagon now provides a new benchmark.
Can a model create a 10-sided wave at the observed latitude?
Can it reproduce the slow drift relative to the much faster jet?
Can it generate the observed vertex oscillations?
Can it produce vertical structure across multiple atmospheric layers?
Can it explain why the north supports a long-lived hexagon while the south recently produced an evolving decagon?
Those are much harder questions than simply making a polygon appear in a simulation.
What Scientists Actually Know Right Now
Hubble has confirmed a 10-sided atmospheric wave around Saturn’s south pole.
The feature is the first large regular-sided jet pattern observed in the southern hemisphere.
Ground-based observers noticed early signs, and Hubble data show the structure was already present in weaker form by 2023.
It became more pronounced by 2025.
Cassini data through 2017 did not show a comparable long-lived feature.
The wave sits inside a powerful southern jet and extends through multiple atmospheric layers.
The published study reports an eastward drift of roughly 2.5 meters per second and oscillating vertices with a period of about 32 days.
Researchers are testing multiple formation mechanisms but have not yet established one definitive cause.
What We Should Not Claim
We should not say Saturn has a solid 10-sided object at its pole.
It is an atmospheric wave.
We should not call the decagon identical to the northern hexagon.
Their dynamics differ.
We should not say the feature definitely formed in 2023.
Hubble confirms it by then; it may have begun earlier.
We should not say seasonal heating caused it.
That remains a possible context, not a demonstrated mechanism.
We should not say the vortex-trigger hypothesis is confirmed.
It is one modeled possibility.
And we should not treat the current shape as permanent.
The reason this discovery is valuable is precisely because the decagon is still evolving.
The Real Discovery Is Not a Shape — It Is a Formation Event
A 10-sided cloud pattern makes a great image.
The deeper story is time.
Cassini saw no long-lived southern polygon.
Hubble later found faint signs.
Then the pattern strengthened.
Now scientists have a chance to watch a planetary-scale atmospheric wave change in real time.
Saturn’s north-polar hexagon has spent decades forcing researchers to ask how such geometry can remain stable.
The southern decagon gives them a different question.
How does one begin?
That may be the more valuable mystery.
NASA’s Roman Space Telescope Has Just Launched — Here’s Why Its Wide-Field Vision Matters
NASA’s Nancy Grace Roman Space Telescope is finally off Earth.
Roman lifted off from Launch Complex 39A at NASA’s Kennedy Space Center at 7:26 a.m. EDT on August 30, 2026, riding a SpaceX Falcon Heavy. It separated from the rocket’s second stage at 7:57 a.m. EDT and began the long coast toward the second Sun-Earth Lagrange point, or L2, roughly 1 million miles from Earth.
The launch is the obvious headline. The more interesting part is what NASA just put into space.
Roman is not simply a newer version of Hubble. It uses a 2.4-meter primary mirror, the same diameter as Hubble’s, but pairs that aperture with a radically wider imaging system. Its primary instrument is built to collect Hubble-class detail across much larger patches of sky and repeat that process fast enough to turn deep-space observation into large-scale surveying.
That changes the engineering problem.
A telescope that sees more sky per exposure needs a larger focal plane. A larger focal plane produces more data. More data requires faster downlinks, larger processing pipelines and a different style of astronomy once those observations reach the ground.
Roman’s real upgrade is therefore not one component.
It is the complete chain from optics to detectors to communications to data processing.
Roman Uses a Hubble-Sized Mirror for a Different Job
Roman’s primary mirror is 2.4 meters, or 7.9 feet, in diameter.
That number matters because Hubble’s primary mirror is the same size.
A larger mirror can collect more light and improve angular resolution, but Roman’s design is not based on making the mirror dramatically larger than Hubble’s. Instead, the mission combines that familiar aperture scale with a much wider field of view.
NASA describes Roman as a wide-area survey machine. Hubble remains exceptionally useful for detailed observations of comparatively narrow fields, while Webb is optimized for deeper infrared work across a smaller view. Roman is designed to cover large areas quickly while preserving sharp imaging.
That distinction is important.
If two telescopes can resolve similar levels of detail but one captures far more sky in each observation, the scientific workflow changes from carefully building one small window at a time to assembling very large maps.
Roman is built around that second mode.
The Wide Field Instrument Is a 300-Megapixel Survey Camera
The Wide Field Instrument, or WFI, is Roman’s primary science instrument.
NASA’s current technical documentation describes it as a 300-megapixel visible-to-near-infrared imaging camera and slitless spectrometer.
At the heart of the instrument is an array of 18 Teledyne H4RG-10 detector assemblies. Each detector contains 4096 by 4096 pixels, giving the full focal plane more than 300 million active pixels.
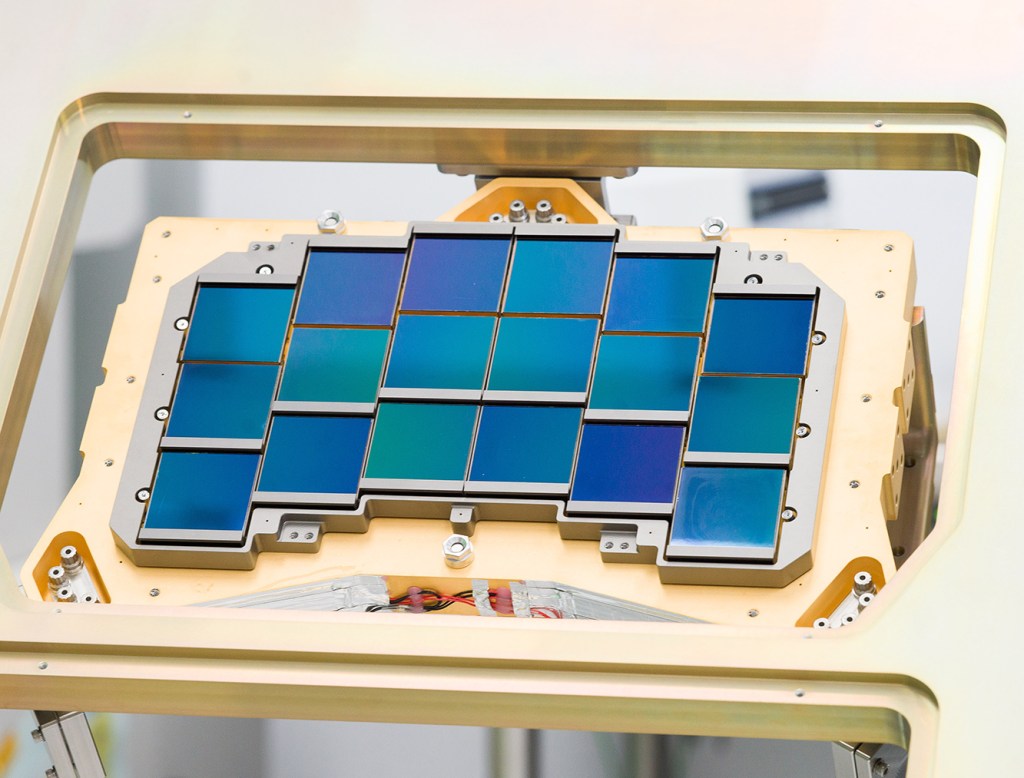
Those detectors are arranged as a large mosaic rather than as one conventional single sensor.
That architecture is the physical reason Roman can capture a much broader view without simply sacrificing image detail. Incoming light is focused across a large focal plane, and the detector array converts that light into electrical signals that become large astronomical images.
The result is not a consumer-style 300-megapixel camera scaled up for space.
It is a cryogenic scientific imaging system designed for stable, repeated measurements across enormous numbers of stars and galaxies.
Eighteen 4K Detectors Create the Wide Focal Plane
Each WFI detector is a 4096-by-4096-pixel sensor.
One detector already contains more than 16 million pixels. Roman uses 18 of them together.
NASA’s focal-plane documentation gives WFI an active field of view of 0.281 square degrees, with spatial sampling of 0.11 arcseconds per pixel. The detectors operate at about 89.5 kelvin and are sensitive across visible and near-infrared wavelengths.
The detector mosaic is not just about adding pixels.
Roman’s optical design spreads a sharp image across a broad curved focal region. The array is arranged to sit within that usable field so the instrument can collect wide images while preserving consistent image quality.
The geometry of the focal plane is therefore part of the telescope architecture.
Wide-field astronomy begins in the mirrors, but it only becomes useful when the detector system can capture that field at scale.
Roman Can Cover About 100 Times More Sky Than Hubble in One Observation
NASA says Roman’s WFI has sensitivity and resolution similar to Hubble while covering about 100 times more sky in a single observation.
The mission can survey the sky up to 1,000 times faster than Hubble.
Those are easy numbers to read past, but they explain why Roman is a different kind of observatory.
A narrow-field telescope can produce extraordinary detail, but surveying a huge region requires many separate pointings. Every pointing consumes observing time. Every repositioning adds overhead. Every exposure contributes another small piece to the final map.
Roman reduces that multiplication.
One image begins with a much larger patch of sky. Repeating that process creates wide surveys with consistent instrumentation and resolution.
NASA has also said that during Roman’s first five years of observations it will image more than 50 times as much sky as Hubble has covered in roughly three decades.
The upgrade is coverage at scientific resolution.
Wide-Field Imaging Changes What Astronomers Can Search For
Large surveys are useful because many astronomical questions are statistical.
Dark matter and dark energy are not understood by photographing one galaxy. Planet populations are not understood from one solar system. Rare transient events are difficult to study if the telescope is looking through a tiny window when they occur.
Roman is designed to repeatedly observe huge populations.
Its core surveys will map large numbers of galaxies, measure the distribution of matter, examine how cosmic structure changes over time and conduct a statistical census of planetary systems in the Milky Way.
The same data can also expose objects that were not the original target of an observation.
That is a major consequence of a survey machine.
The instrument does not need to know every interesting object in advance. It can build large datasets first, then let astronomers search those datasets for patterns, outliers and unexpected events.
Roman Is Built for Imaging and Slitless Spectroscopy
WFI does more than take pictures.
Its element wheel supports imaging, spectroscopy and calibration modes. NASA lists eight imaging filters spanning roughly 0.48 to 2.3 micrometers, along with prism and grism modes for full-field slitless spectroscopy.
Slitless spectroscopy allows the instrument to spread the light from many objects into spectra without placing a narrow physical slit over one target at a time.
That makes sense for a survey telescope.
Roman can observe a broad field and gather spectral information across many sources within it. Those spectra help researchers estimate properties such as redshift and composition while keeping the mission aligned with its large-area observing strategy.
Again, the hardware and the mission model match.
The wide field is not an isolated camera feature. Imaging modes, spectroscopy, calibration and survey cadence are designed around the same large-scale measurement problem.
The Hidden Upgrade Is the Data Pipeline
A wide-field telescope creates a second engineering problem the moment the detectors start working.
Data.
NASA expects Roman to return about 1.4 terabytes of science data every day. The agency describes that as the highest daily data rate yet for a NASA astrophysics mission.
The ground system has therefore been designed as part of the observatory rather than as an afterthought.
Roman will use Ka-band communications for high-rate science downlinks at speeds up to 500 megabits per second. S-band links handle commands and engineering telemetry at much lower rates.
Multiple ground contacts over several hours allow the observatory to move that daily science volume back to Earth.
The telescope may be a million miles away, but the mission only works if its data can keep flowing.
1.4 Terabytes per Day Changes the Ground Architecture Too
Once Roman’s data reaches Earth, another chain begins.
NASA’s ground systems are distributed across multiple institutions responsible for mission operations, science operations, science support, flight dynamics and the Coronagraph technology demonstration.
The data has to be received, calibrated, processed, archived and made useful to scientists.
Roman’s five-year primary mission is expected to generate an enormous public scientific archive. NASA’s recent mission material also says machine learning, artificial intelligence and citizen scientists will help sift through the incoming volume and flag potentially significant findings for follow-up.
That does not mean an AI system replaces the science team.
It means the scale of the archive makes automated filtering and classification useful parts of the workflow.
A wider telescope view therefore propagates all the way into software.
More sky creates more detections. More detections create more data. More data creates a need for more automated processing.
Roman’s Surveys Can Become a Discovery Layer for Other Telescopes
Roman does not need to replace Hubble or Webb to be valuable beside them.
NASA has described the three observatories in complementary terms: Hubble as a detail expert, Webb as a deep-infrared specialist and Roman as the wide-area survey machine.
That creates a useful division of labor.
Roman can scan broad regions and identify unusual galaxies, changing objects, gravitational-lensing events or promising planetary systems. A narrower instrument can then spend more time examining selected targets in greater depth or at different wavelengths.
This is similar to using a wide-angle lens to find the scene before switching to a telephoto lens for the detail.
The important difference is that Roman’s wide-angle view still operates at space-telescope resolution.
Its surveys can become a discovery layer that tells the rest of the astronomy ecosystem where the interesting targets are.
The Coronagraph Is a Separate Technology Demonstration
Roman also carries the Coronagraph Instrument, but it serves a different role from WFI.
The Coronagraph is a technology demonstration designed to test advanced direct-imaging hardware for planets around other stars.
A star is enormously brighter than the planets orbiting it. To see a faint planet directly, the instrument must suppress the star’s light with extreme precision.
Roman’s Coronagraph combines masks, precision optics, detectors and active wavefront control to reduce that glare.
NASA says the system is designed to demonstrate capabilities roughly 100 to 1,000 times beyond previous space-based coronagraphs.
The immediate targets are not Earth twins.
Roman is expected to demonstrate direct imaging of large gaseous worlds, including Jupiter-like planets, and surrounding disks while proving technologies that could be used in future observatories.
Deformable Mirrors Correct the Wavefront in Real Time
Two deformable mirrors are among the Coronagraph’s most important pieces of hardware.
Thousands of actuators can move tiny sections of the mirror surfaces like microscopic pistons.
Those adjustments compensate for very small optical errors that would otherwise scatter starlight into the area where a faint planet needs to be detected.
The system measures the wavefront, calculates corrections and changes the mirror shape to create a much darker region around the star.
This is active optics operating at an extraordinary level of precision.
Roman’s Coronagraph is valuable because it moves this class of control from laboratory demonstrations into an operational space environment.
Future missions can then build on measurements of how the masks, detectors, control algorithms and deformable mirrors perform once they are actually flying.
The Coronagraph Points Beyond Roman
NASA explicitly connects Roman’s Coronagraph work to future planet-imaging missions.
The proposed Habitable Worlds Observatory would need even more capable starlight suppression to study smaller, fainter worlds that may resemble Earth.
Roman is not that mission.
Its job is to demonstrate parts of the technology stack that a later observatory could refine and scale.
That makes the Coronagraph a useful engineering bridge.
Roman can produce science with the instrument while also answering practical questions about wavefront sensing, mirror control, masks, detectors and stability in space.
A successful technology demonstration does not guarantee the design of every future telescope.
It does something more concrete: it converts key techniques from theoretical or laboratory capability into flight experience.
The Journey to L2 Is Part of a Three-Month Commissioning Period
Roman is not beginning normal science operations immediately after launch.
The spacecraft is traveling toward an orbit around Sun-Earth L2, about 1 million miles from Earth. NASA expects the journey and commissioning process to take roughly three months.
During that period, controllers deploy hardware, perform trajectory corrections, activate instruments, calibrate systems and verify that the observatory performs as designed.
NASA said the Coronagraph will power on during the early part of the journey, while WFI is expected to activate a few weeks after launch.
The telescope then goes through additional tests before routine science work begins.
NASA currently anticipates releasing Roman’s first images in early 2027.
Launch put the hardware into space.
Commissioning turns that hardware into an observatory.
Roman’s Architecture Is Built Around Scale From End to End
The most interesting part of Roman is how consistently one design choice appears through the entire mission.
Scale.
A 2.4-meter mirror supplies the light-gathering power. A wide optical field spreads sharp images across a large focal plane. Eighteen 4K detectors turn that field into 300-megapixel observations. Imaging and slitless spectroscopy let the telescope gather information across many sources at once.
Then the communications system has to return 1.4 terabytes per day. Ground centers have to process and archive it. Automated tools help researchers search the stream for useful signals.
The mission is not just a telescope with a wider camera attached.
It is an end-to-end survey architecture.
The optical design, focal plane, observing modes, communications system and data workflow all exist to support the same idea: observe a very large fraction of the universe with consistent detail and do it repeatedly.
Roman’s Real Upgrade Is Seeing Hubble-Class Detail Across Vastly More Sky
The Falcon Heavy launch is the event that put Roman into the news.
The enduring story is the observing model now heading toward L2.
Roman takes a mirror in Hubble’s size class and connects it to a focal plane built for panoramic science. Its Wide Field Instrument can capture around 100 times more sky per observation than Hubble while preserving similar sensitivity and resolution. Its survey speed can be up to 1,000 times faster.
That wider view creates a chain reaction.
More sky means more galaxies, more stars, more planetary events and more unexpected objects in every observing program. It also means a much larger data stream, which is why Roman’s ground and processing architecture matters almost as much as its optics.
The Coronagraph adds a second track by testing technologies that could shape the next generation of direct-imaging missions.
Roman is therefore not Hubble 2.0.
It is a different upgrade path.
Instead of asking only how much deeper one telescope can look, Roman asks what happens when high-quality space imaging becomes a survey system built for scale.
Now that system is on its way to L2.